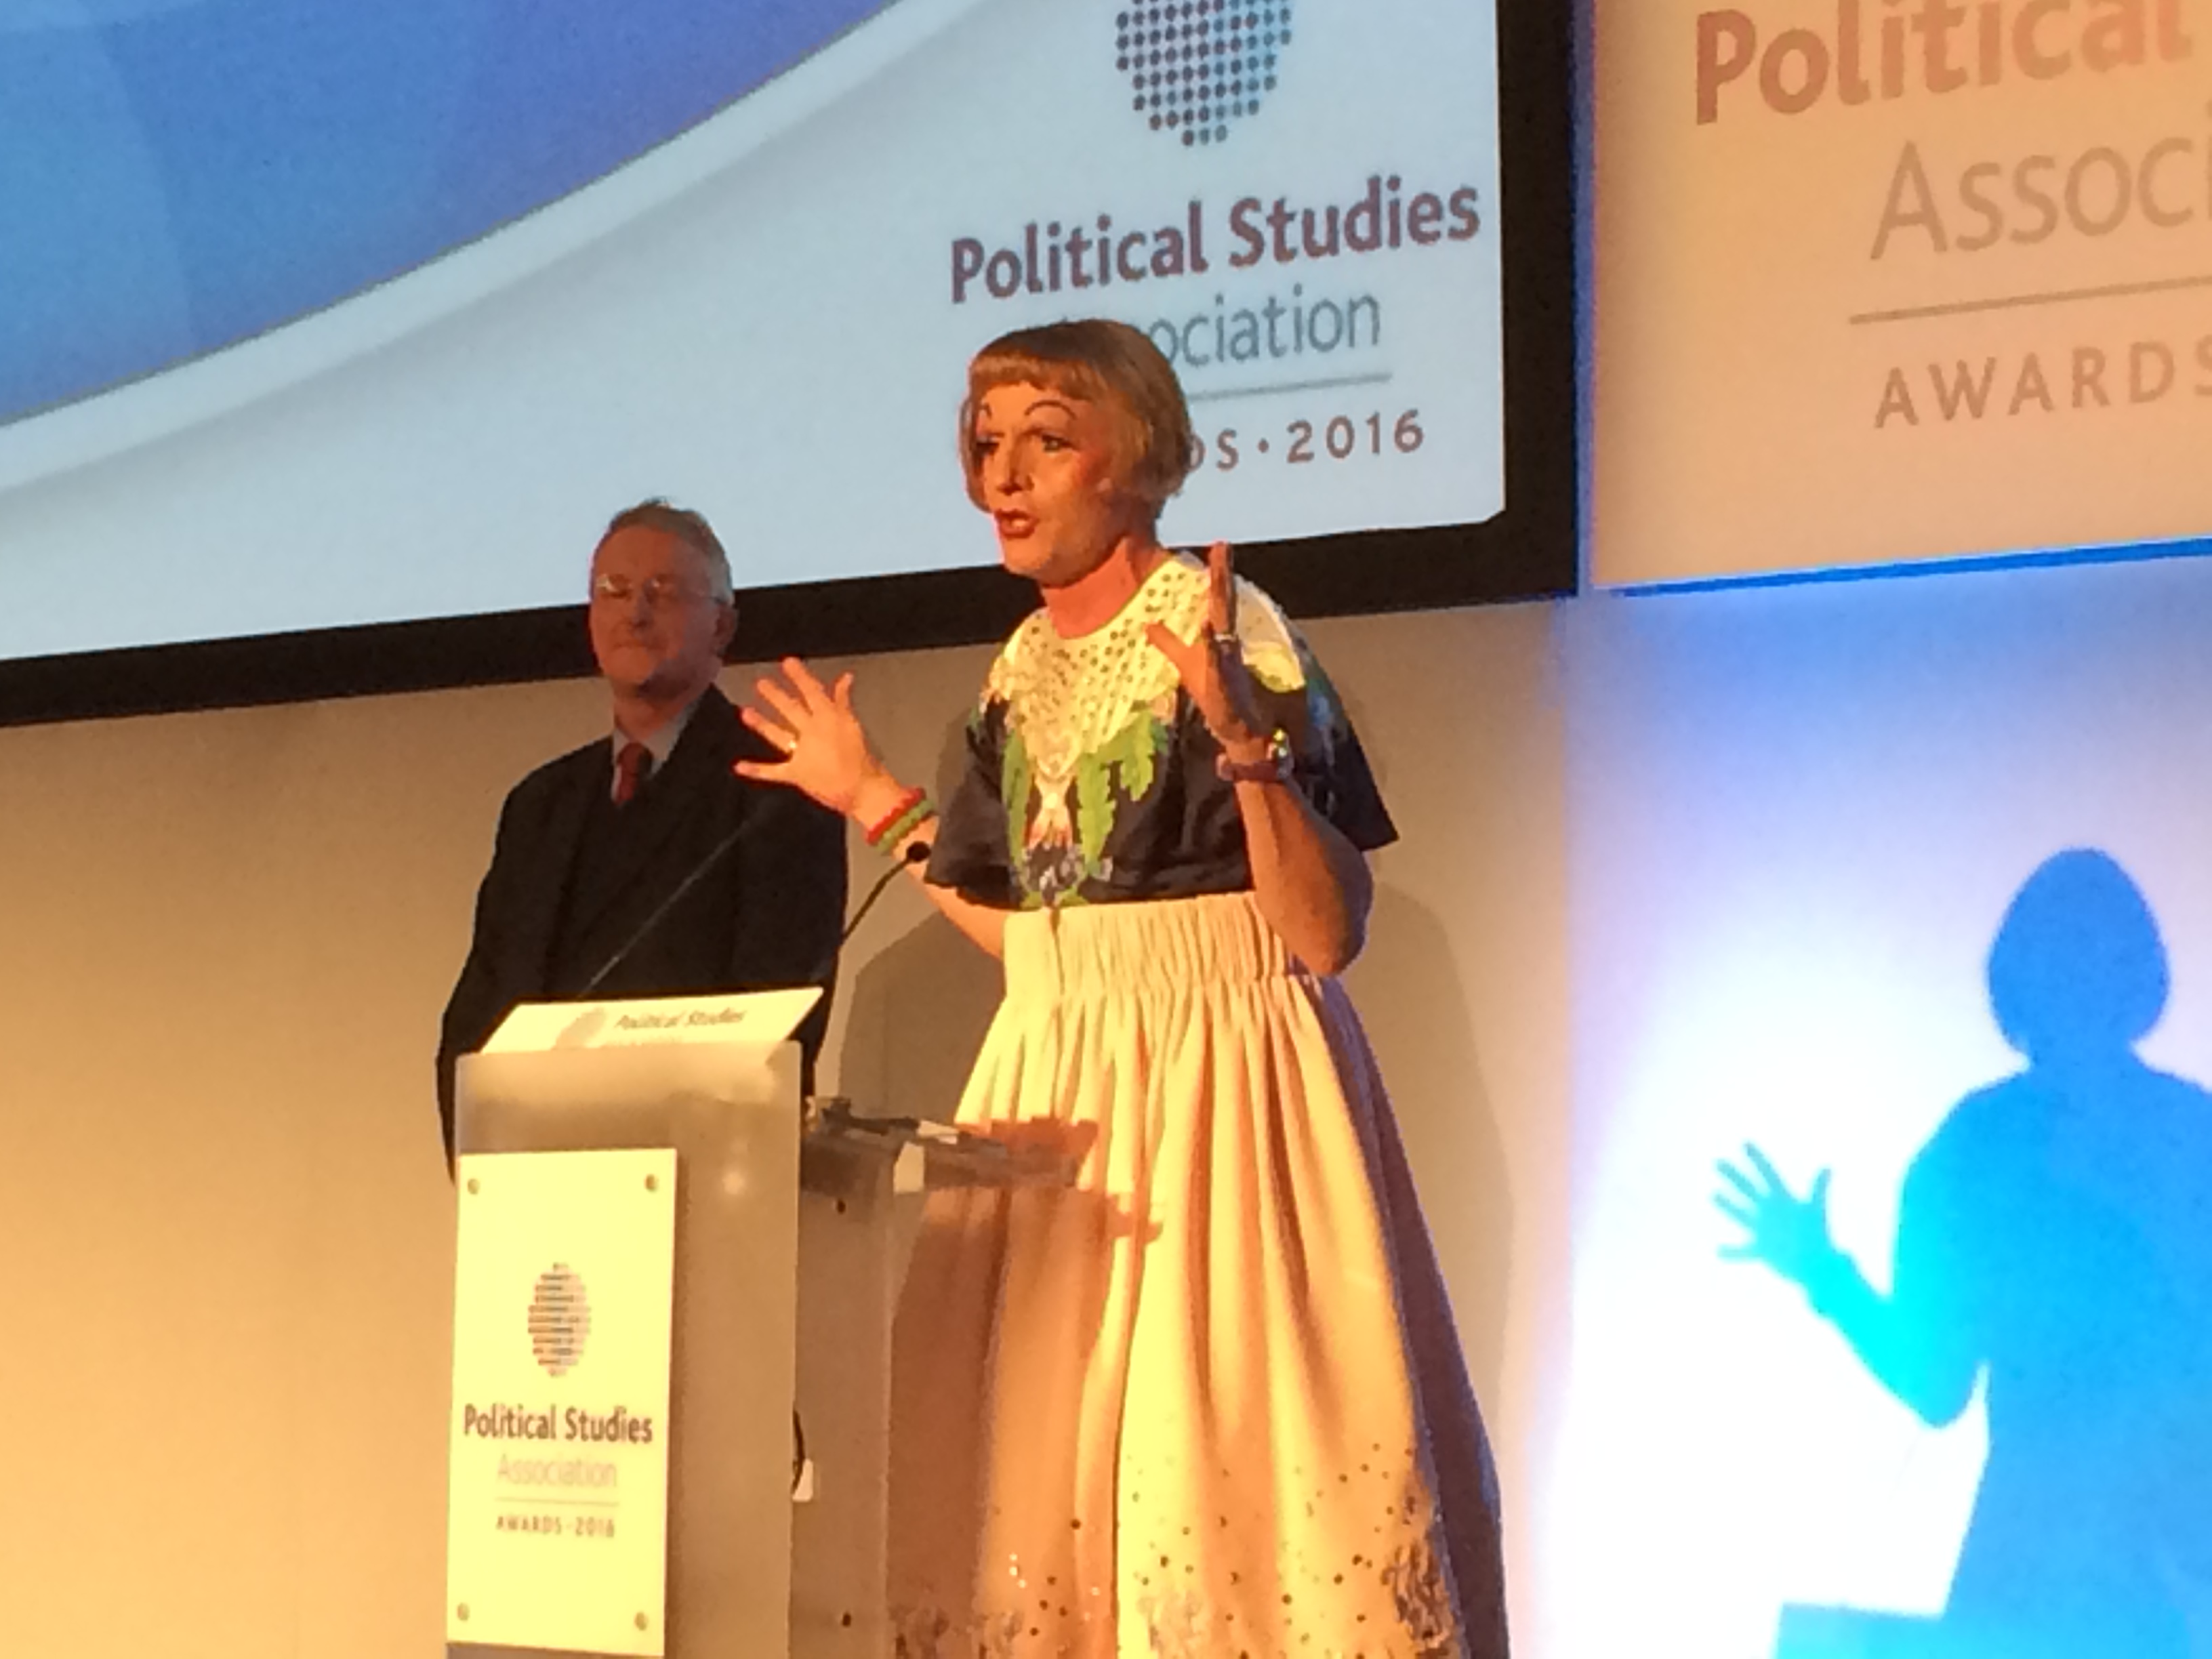
Last week, I attended the Political Studies Association annual awards ceremony (I was there to receive the W.J.M. Mackenzie book prize for the book I wrote with Christopher Hood 🙂 ). The final award of the evening was to Grayson Perry, for his contribution to Art and Culture.

Grayson Perry at the PSA Awards. Hilary Benn MP, who presented the award, is also pictured. (Photo: Ruth Dixon)
Grayson Perry’s acceptance speech was remarkable, pointing out to the assembled politicians, journalists, pundits, and academics that for all their intellectual knowledge, they may be missing something important (the following extract is transcribed with minor edits from BBC iplayer starting at about 27 min):
“I think the word ‘truth’ is interesting. Because we’ve often talked about truth in terms of academic truth, statistical truth, empirical truth, scientific truth, but we talk very little about emotional truth. And I think that one thing that all of the experts here need to zhoosh up a bit is their emotional literacy. The liberal academic elite have let us down because they are not emotionally literate enough to really understand what fifty-two per cent of the population were thinking, or feeling, should I say.
“There’s a whole world out there that we need to have more empathy with, even if we don’t like the results those kind of feelings bring about. But I thank you for this award from the experts – and I hope that next year you are giving an award for ‘most empathetic’ politician of the year.”
Grayson Perry’s plea for empathy struck a chord with me. Terms such as ‘authoritarian populism’ and ‘post-truth’ are often used by academics and commentators to belittle those with whom the author disagrees. It is all too easy to raise a laugh in a seminar by saying something that disparages Brexiters or Trump voters. Although I voted ‘Remain,’ I feel very uncomfortable when such partisan attitudes are displayed by publicly-funded academics particularly when the targets of their derision are (directly or indirectly) among the subjects of their research.
Some academics have taken a more thoughtful approach. Bo Rothstein and Lennart Levi suggest that teaching ethics should be a priority for universities in order to improve the behaviour of university-educated elites. And Will Jennings and Martin Lodge argue that political scientists should seek a much deeper engagement with society to protect the ‘foundations of liberal democracy.’ While these approaches have much to recommend them, these articles give a somewhat de haut en bas impression, that if only academics communicated certain ‘truths’ better, public attitudes and policymakers’ behaviour would change accordingly.
This attitude has parallels with the ‘deficit model’ of the public understanding of science (that increasing public understanding of science will increase public acceptance of scientific advances such as GM foods or nuclear power). There is much research that suggests that this model is too simplistic, and that emotions and identity play an important part. So I suggest that political scientists need to question, with some humility, their own ‘deficit model’ of the public understanding of politics.
[update 12-12-16] While I have not seen the phrase ‘deficit model’ applied to public understanding of politics, there is of course plenty of relevant research. For example, greater factual knowledge about the EU does not correlate with positive feelings about it. And Bo Rothstein’s own research shows that ethical concepts such as corruption are understood in very similar ways across different cultures (the differences in levels of corruption are attributed not “to different moral understandings of the problem of corruption but to how different societies come to understand and value the difference between public and private goods and also what most people expect that most other people in their society will do when faced with opportunities for bribery.”)
Finally, and on a lighter note, if you would like to see the UK ‘elite’ at play, the PSA’s flickr album contains 250 photos of the award ceremony. Photos of Christopher Hood and me collecting our award are on p.2. We also wrote an article on government costs (updating the themes of our book) to accompany the announcement of our award. As well as the PSA itself, Sage and OUP also cover the awards.
[Update 20-12-2016] This post, with minor edits, was reposted on the LSE Impact of Social Sciences blog.